The Browser Interface
The SDK gives you a useful web interface to use while making your sift. This will be opened automatically in Chrome if you are running in non-docker mode. If you are running in docker you should open it at localhost:7438.
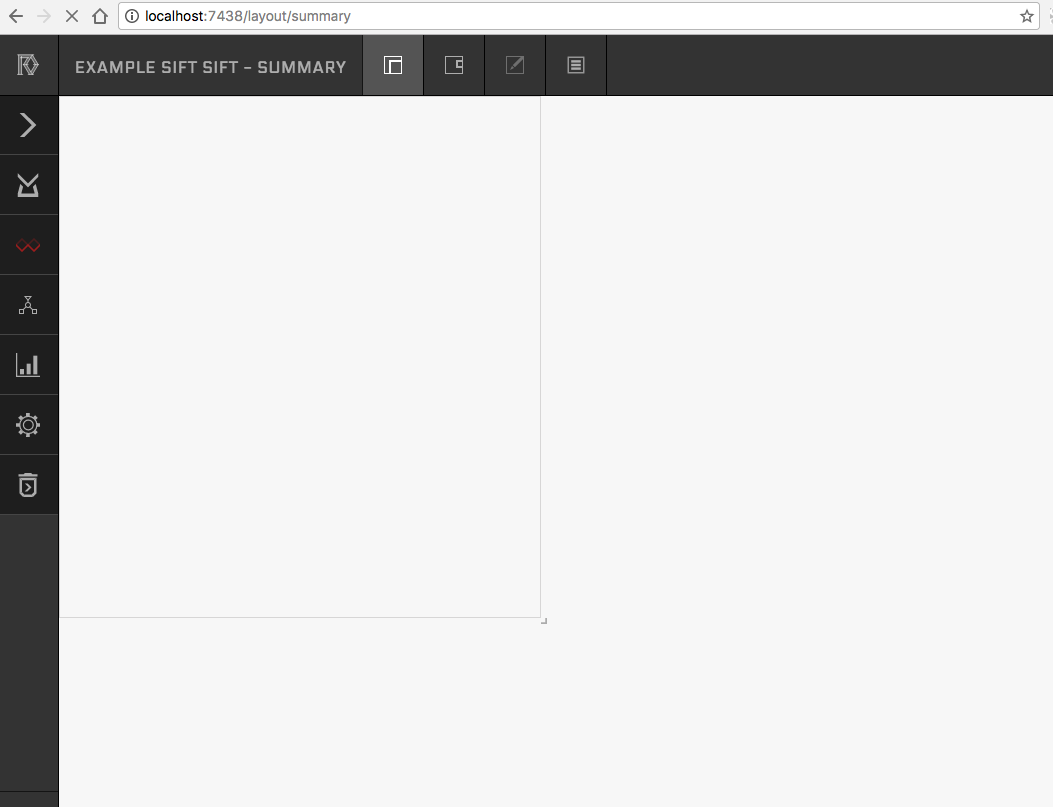
The initial web view looks something like this:

This white card is what a user sees in their mail client when they install Red Sift for Gmail or on their home screen at redsift.cloud. It is meant to provide an at a glance overview of the data your Sift has processed and the relevant insights you want presented.
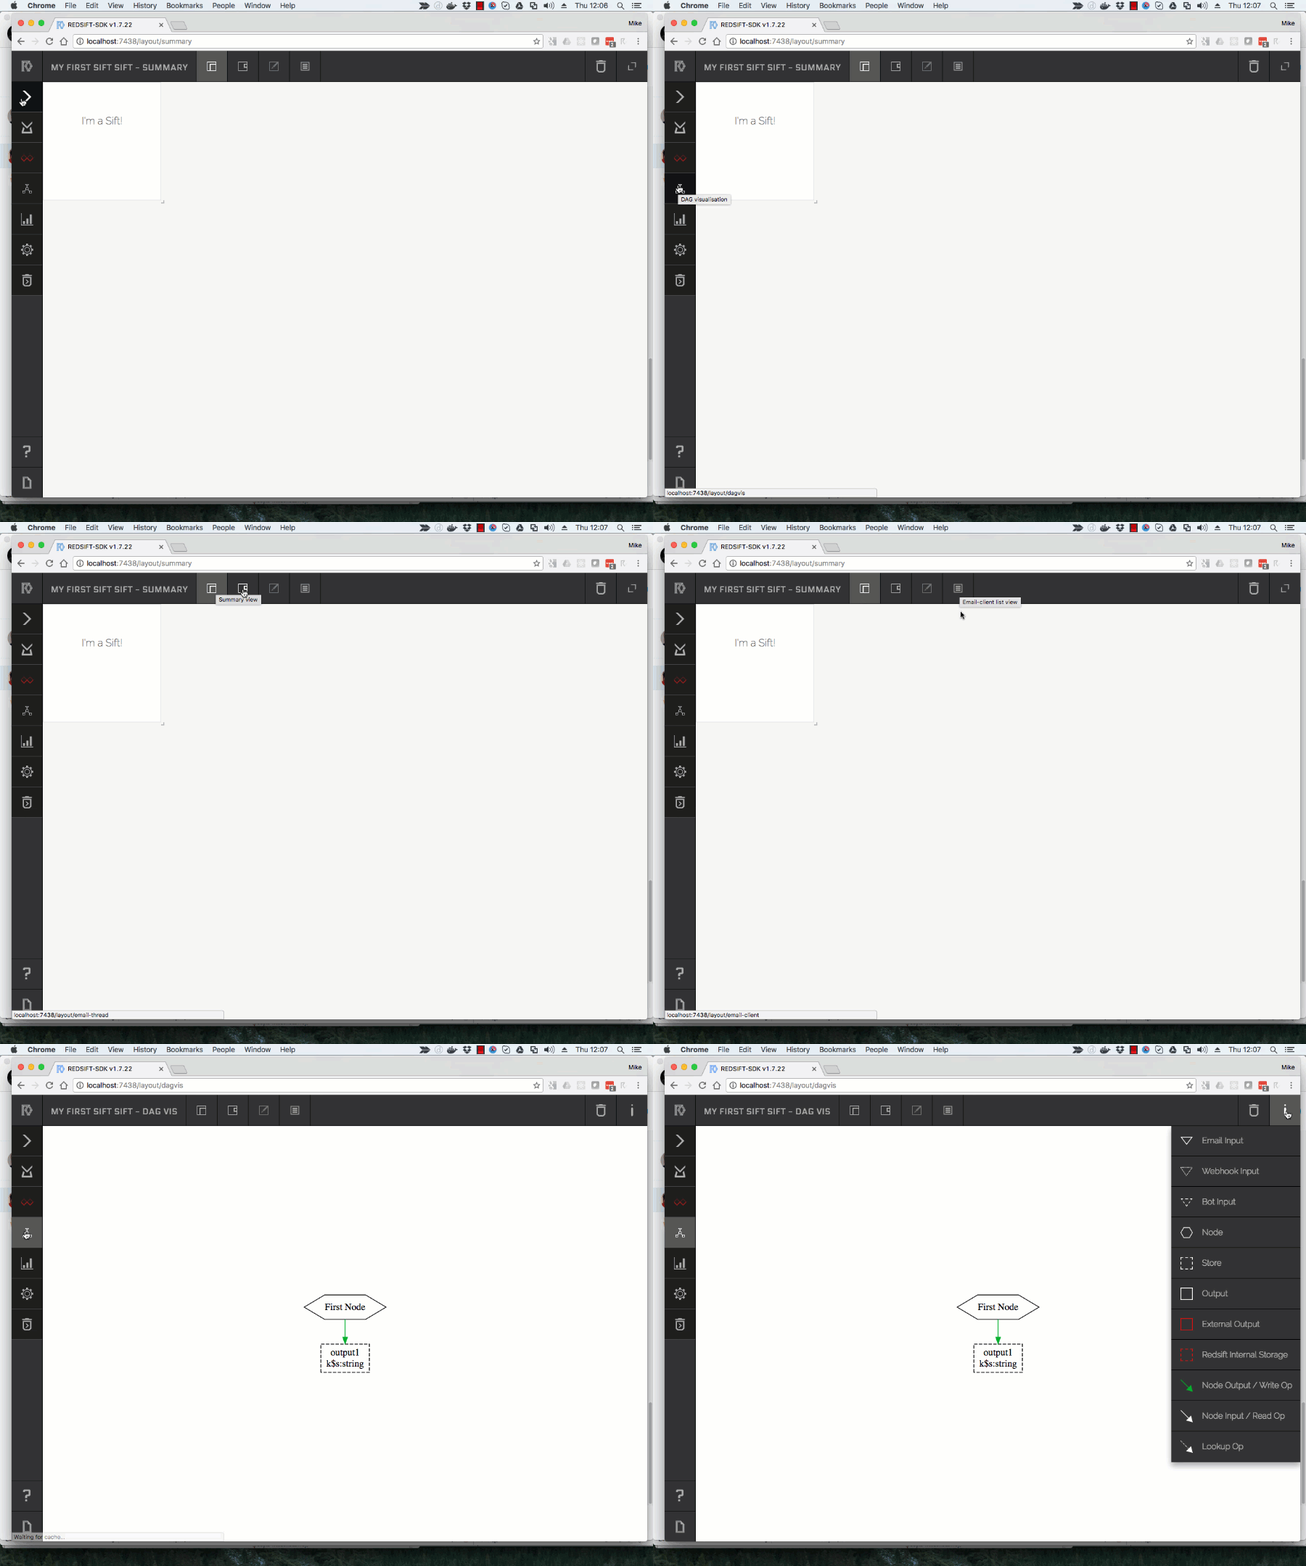
If you hover your mouse over the icons on the left hand side or on the top, you'll see tooltips that tell you what they do. Click on the fifth one down on the right, DAG visualisation.
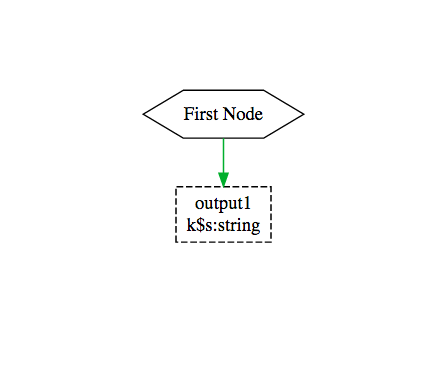
You should now see this in the SDK pane:

This is a visualisation of your Sift. It shows us that the minimal-sift template has created one initial node, plus a string type output store. You can use the visualisation as you are going through this tutorial to check that you are on course.

Note that the
iicon at the far right of the top menu, gives you a key to the meaning of the colours and symbols in the visualisation
Updated less than a minute ago
